Scalable Visual Analytics
(December 10, 2016) Update: Please head on
over to the  website for the latest. This page is no longer actively maintained.

SeeDB: Automatic Visualization Recommendation
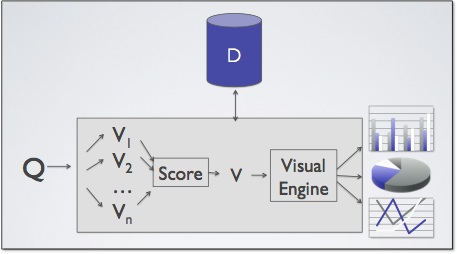
Data analysts operating on large volumes of data often rely on visualizations to interpret the results of queries. However, finding the right visualization for a query is a laborious and time-consuming task. We have developed SeeDB, a system that partially automates this task: given a query, SeeDB explores the space of all possible visualizations, and automatically identifies and recommends to the analyst those visualizations it finds to be most “interesting” or “useful”.

Approximate Scalable Visualization Generation
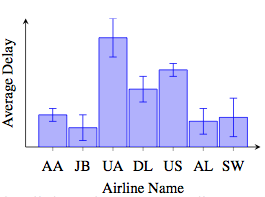
Visualizations are frequently used as a means to understand trends and gather insights from datasets, but often take a long time to generate. In this project, we focus on the problem of rapidly generating approximate visualizations while preserving crucial visual properties of interest to analysts. For instance, our algorithms can be used to generate an approximate visualization of a bar chart very rapidly, where the comparisons between any two bars are correct. Our techniques are optimal in theory and also take orders of magnitude fewer samples and much less time than conventional sampling schemes in practice.